
去年就开始关注net core了,只是平时写写demo,没用在项目中,正好这次机会就用了net core,具体是什么时候开始的不太记得了,总之刚开始是用core 1.0开发,然后在开发的时候突然想到,平时我们的项目中都没有做过项目的实时监控,为什么这次不试试看呢,而且还能知道每天什么时段的流量走向,系统吞吐量等。记得之前去北京总公司的时候,看到java开发部那边有一个大屏幕,实时的显示项目的吞吐量、请求量等信息,感觉非常酷,我们net应该可以可以实现吧。
抱着这总心态就去找了一些相关资料,也就在项目用了起来。
项目部署在windows环境下,Influxdb的介绍这里不再赘述。
1、首先安装InfluxDB时序数据库,地址如下:https://portal.influxdata.com/downloads#influxdb ,这里我就下载Windows Binaries (64-bit),具体的写一下配置文件和安装过程。
解压后打开influxdb.conf,因为influxdb的默认配置全是针对linux配置的,所以我们需要修改一下配置文件。
修改下面3个liunx的路径,改为winodws路径如下:
[meta]
  # Where the metadata/raft database is stored
  dir = "influxdb/meta"
[data]
  # The directory where the TSM storage engine stores TSM files.
  dir = "influxdb/data"
  # The directory where the TSM storage engine stores WAL files.
  wal-dir = "influxdb/wal"
我将influxdb的文件都放在了influxdb目录下,可以用相对位置,也可以用绝对位置,这个可以根据个人需要修改。
这里提一下,Influxdb v1.2.4之后好像网页图形化管理界面就去掉了,1.2.4之前的是有网页图形化管理界面的,influxdb.conf文件之前还有
[admin]
  # Determines whether the admin service is enabled.
   enabled = true

  # The default bind address used by the admin service.
   bind-address = ":8083"
不过后面的版本,conf文件里就没有这个了,所以大家要注意一下。后面版本没办法用网页图形化管理,如果要连接Influxdb的话可以在目录下以cmd运行influx.exe,如果不想所有人都可以访问你的InfluxDB,那么你可以在conf文件里配置认证信息
# Determines whether HTTP endpoint is enabled.
enabled = true
# The bind address used by the HTTP service.
bind-address = ":8086"
# Determines whether user authentication is enabled over HTTP/HTTPS.
auth-enabled = true
最后cmd运行,进入到你的解压目录,执行命令:
influxd -config influxdb.conf
这里说一下,使用influx.exe登录时,输入以下命令:influx -host 127.0.0.1 -port 8086 -username "admin" -password "123456",这样就连上InfluxDB了。然后创建数据库:CREATE DATABASE "AppMetricsDemo"。
如果你觉得这样比较麻烦,可以安装两个influxDB,一个是V1.2.4版的,一个是最新版的,这是需要修改配置文件的端口,将两个influxDB的端口修改成不一样的就好,然后用1.2.4版本的连接最新版的即可,如图,点击右上角的齿轮图标即可出现连接表单,
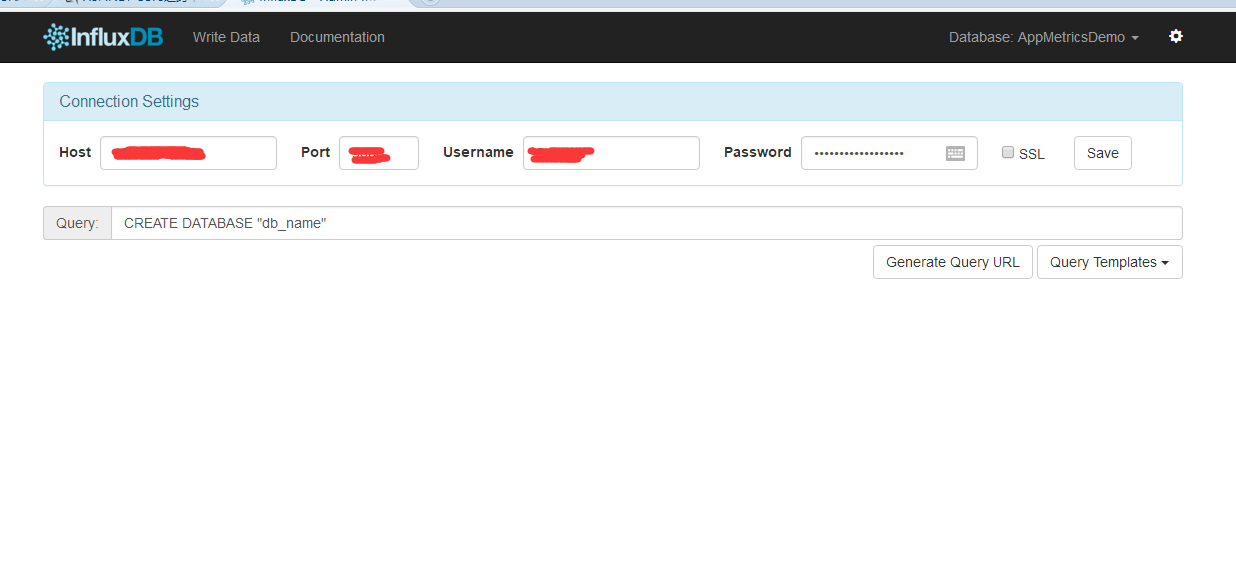
(安装好influxDB后,记得在influxDB中创建Demo需要的数据库“AppMetricsDemo”)
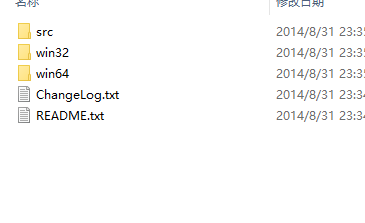
2、安装Grafana,下载地址:https://grafana.com/get,我们解压后进入bin目录,如图:
直接运行grafana-server.exe即可。
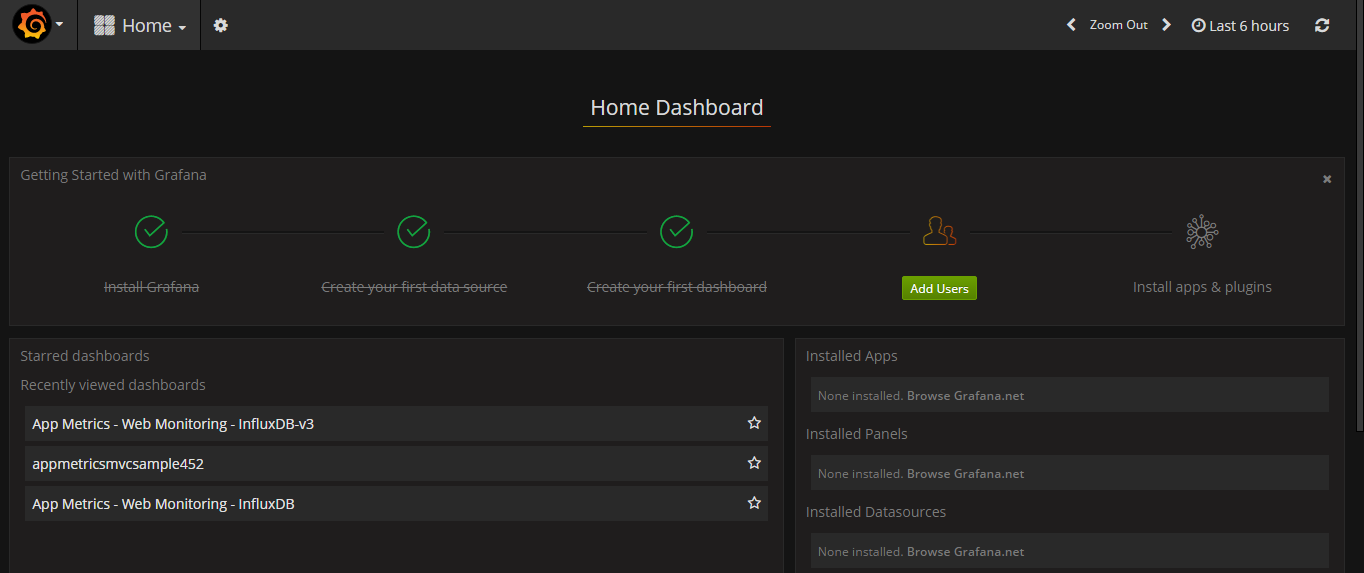
Grafana默认会监听3000的端口,所以我们进入http://localhost:3000,
会让你登陆,直接输入本地的管理员帐户即可,帐户:admin 密码:admin,进入后如图:
安装完成之后,我们下载相关仪表模版的Json文件。
地址如下:https://grafana.com/dashboards/2125
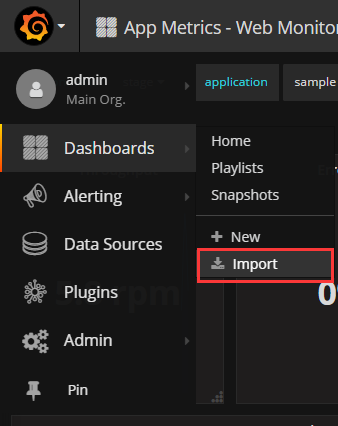
然后我们导入我们的仪表:如图操作即可
添加我们上面的数据源,如图:
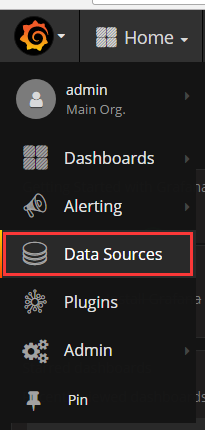
选择Add DataSource,然后操作如下:
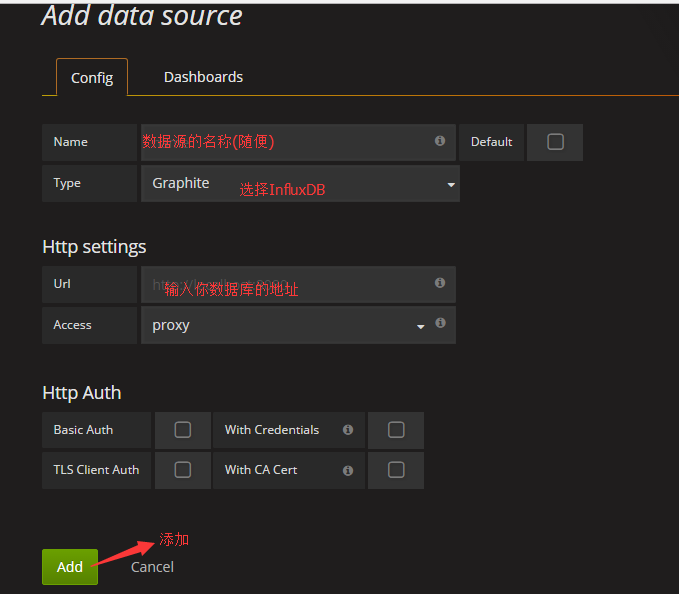
这样,我们就完成了Grafana的安装配置和添加数据源。
由于实际项目中,我们不可能在服务器上运行个控制台去开启这些服务,所以我们需要将influxDB和Grafana发布成服务的形式运行在服务器上,这里我们可以使用nssm工具将InfluxDB和Grafana封装成服务运行。
下载地址如下:http://www.nssm.cc/download
解压后进入到对应系统版本文件夹中,里面有个32位和64位的文件,根据自己的实际情况选择,如图:
我们选择win64,进入文件夹后运行cmd,输入nssm install InfluxDB 运行后出现如下界面:
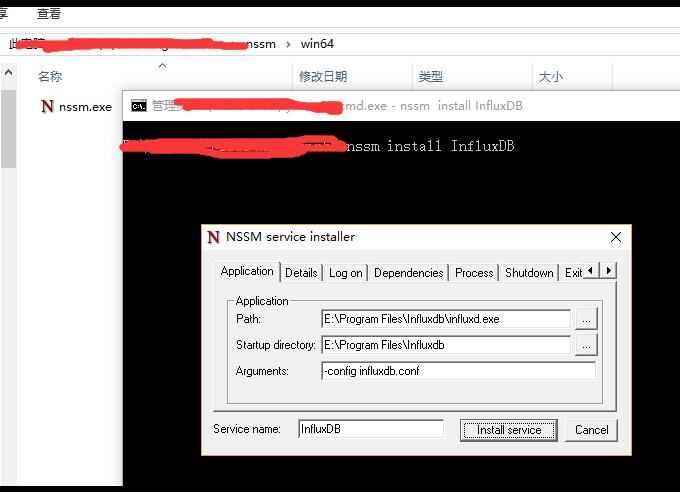
重点说一下参数这一栏,Argument里输入:-config influxdb.conf,类似上面在cmd中输入Influxd -config influxdb.conf
安装好后运行起来就好,Grafana的安装类似上面的操作,只是Argument这一栏不需要输入任何东西。
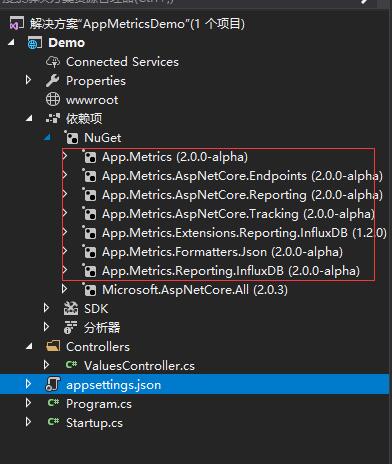
3、.netCore 中使用AppMetrics,新建一个名为Demo 的api,然后编辑右键编辑 Demo.csproj文件,在ItemGroup节点下新增以下Package
<PackageReference Include="App.Metrics" Version="2.0.0-alpha" />
<PackageReference Include="App.Metrics.AspNetCore.Endpoints" Version="2.0.0-alpha" />
<PackageReference Include="App.Metrics.AspNetCore.Reporting" Version="2.0.0-alpha" />
<PackageReference Include="App.Metrics.AspNetCore.Tracking" Version="2.0.0-alpha" />
<PackageReference Include="App.Metrics.Extensions.Reporting.InfluxDB" Version="1.2.0" />
<PackageReference Include="App.Metrics.Formatters.Json" Version="2.0.0-alpha" />
<PackageReference Include="App.Metrics.Reporting.InfluxDB" Version="2.0.0-alpha" />
保存后,项目就引用了AppMetrics相关类库
然后修改appsettings.json文件。添加如下代码
|
{
"Logging": {
"IncludeScopes": false,
"Debug": {
"LogLevel": {
"Default": "Warning"
}
},
"Console": {
"LogLevel": {
"Default": "Warning"
}
}
},
"InfluxDB": {
"IsOpen": true,
"DataBaseName": "AppMetricsDemo",
"ConnectionString": "http://10.10.134.109:8086",
"username": "admin",
"password": "123456",
"app": "RepairApp",
"env": "stage"
}
}
|
ConfigureServices方法,如下:
|
1
2
3
4
5
6
7
8
9
10
11
12
13
14
15
16
17
18
19
20
21
22
23
24
25
26
27
28
29
30
31
32
33
34
35
36
37
38
39
40
41
42
43
44
45
46
47
48
49
50
51
52
53
54
55
56
57
58
59
60
61
62
63
64
65
66
67
68
69
70
71
72
73
74
75
76
77
78
79
80
81
82
83
84
85
86
87
88
89
90
91
92
93
94
95
96
97
98
99
100
101
102
103
104
|
using System;
using System.Collections.Generic;
using System.Linq;
using System.Threading.Tasks;
using Microsoft.AspNetCore.Builder;
using Microsoft.AspNetCore.Hosting;
using Microsoft.Extensions.Configuration;
using Microsoft.Extensions.DependencyInjection;
using Microsoft.Extensions.Logging;
using Microsoft.Extensions.Options;
using App.Metrics;
namespace Demo
{
public class Startup
{
public Startup(IConfiguration configuration)
{
Configuration = configuration;
}
public IConfiguration Configuration { get; }
// This method gets called by the runtime. Use this method to add services to the container.
public void ConfigureServices(IServiceCollection services)
{
#region Metrics监控配置
string IsOpen = Configuration.GetSection("InfluxDB")["IsOpen"].ToLower();
if (IsOpen == "true")
{
string database = Configuration.GetSection("InfluxDB")["DataBaseName"];
string InfluxDBConStr = Configuration.GetSection("InfluxDB")["ConnectionString"];
string app = Configuration.GetSection("InfluxDB")["app"];
string env = Configuration.GetSection("InfluxDB")["env"];
string username = Configuration.GetSection("InfluxDB")["username"];
string password = Configuration.GetSection("InfluxDB")["password"];
var uri = new Uri(InfluxDBConStr);
var metrics = AppMetrics.CreateDefaultBuilder()
.Configuration.Configure(
options =>
{
options.AddAppTag(app);
options.AddEnvTag(env);
})
.Report.ToInfluxDb(
options =>
{
options.InfluxDb.BaseUri = uri;
options.InfluxDb.Database = database;
options.InfluxDb.UserName = username;
options.InfluxDb.Password = password;
options.HttpPolicy.BackoffPeriod = TimeSpan.FromSeconds(30);
options.HttpPolicy.FailuresBeforeBackoff = 5;
options.HttpPolicy.Timeout = TimeSpan.FromSeconds(10);
options.FlushInterval = TimeSpan.FromSeconds(5);
})
.Build();
services.AddMetrics(metrics);
services.AddMetricsReportScheduler();
services.AddMetricsTrackingMiddleware();
services.AddMetricsEndpoints();
}
#endregion
services.AddMvc();
}
// This method gets called by the runtime. Use this method to configure the HTTP request pipeline.
public void Configure(IApplicationBuilder app, IHostingEnvironment env)
{
if (env.IsDevelopment())
{
app.UseDeveloperExceptionPage();
}
#region 注入Metrics
string IsOpen = Configuration.GetSection("InfluxDB")["IsOpen"].ToLower();
if (IsOpen == "true")
{
app.UseMetricsAllMiddleware();
// Or to cherry-pick the tracking of interest
app.UseMetricsActiveRequestMiddleware();
app.UseMetricsErrorTrackingMiddleware();
app.UseMetricsPostAndPutSizeTrackingMiddleware();
app.UseMetricsRequestTrackingMiddleware();
app.UseMetricsOAuth2TrackingMiddleware();
app.UseMetricsApdexTrackingMiddleware();
app.UseMetricsAllEndpoints();
// Or to cherry-pick endpoint of interest
app.UseMetricsEndpoint();
app.UseMetricsTextEndpoint();
app.UseEnvInfoEndpoint();
}
#endregion
app.UseMvc();
}
}
}
|
代码这一块基本上完成了。
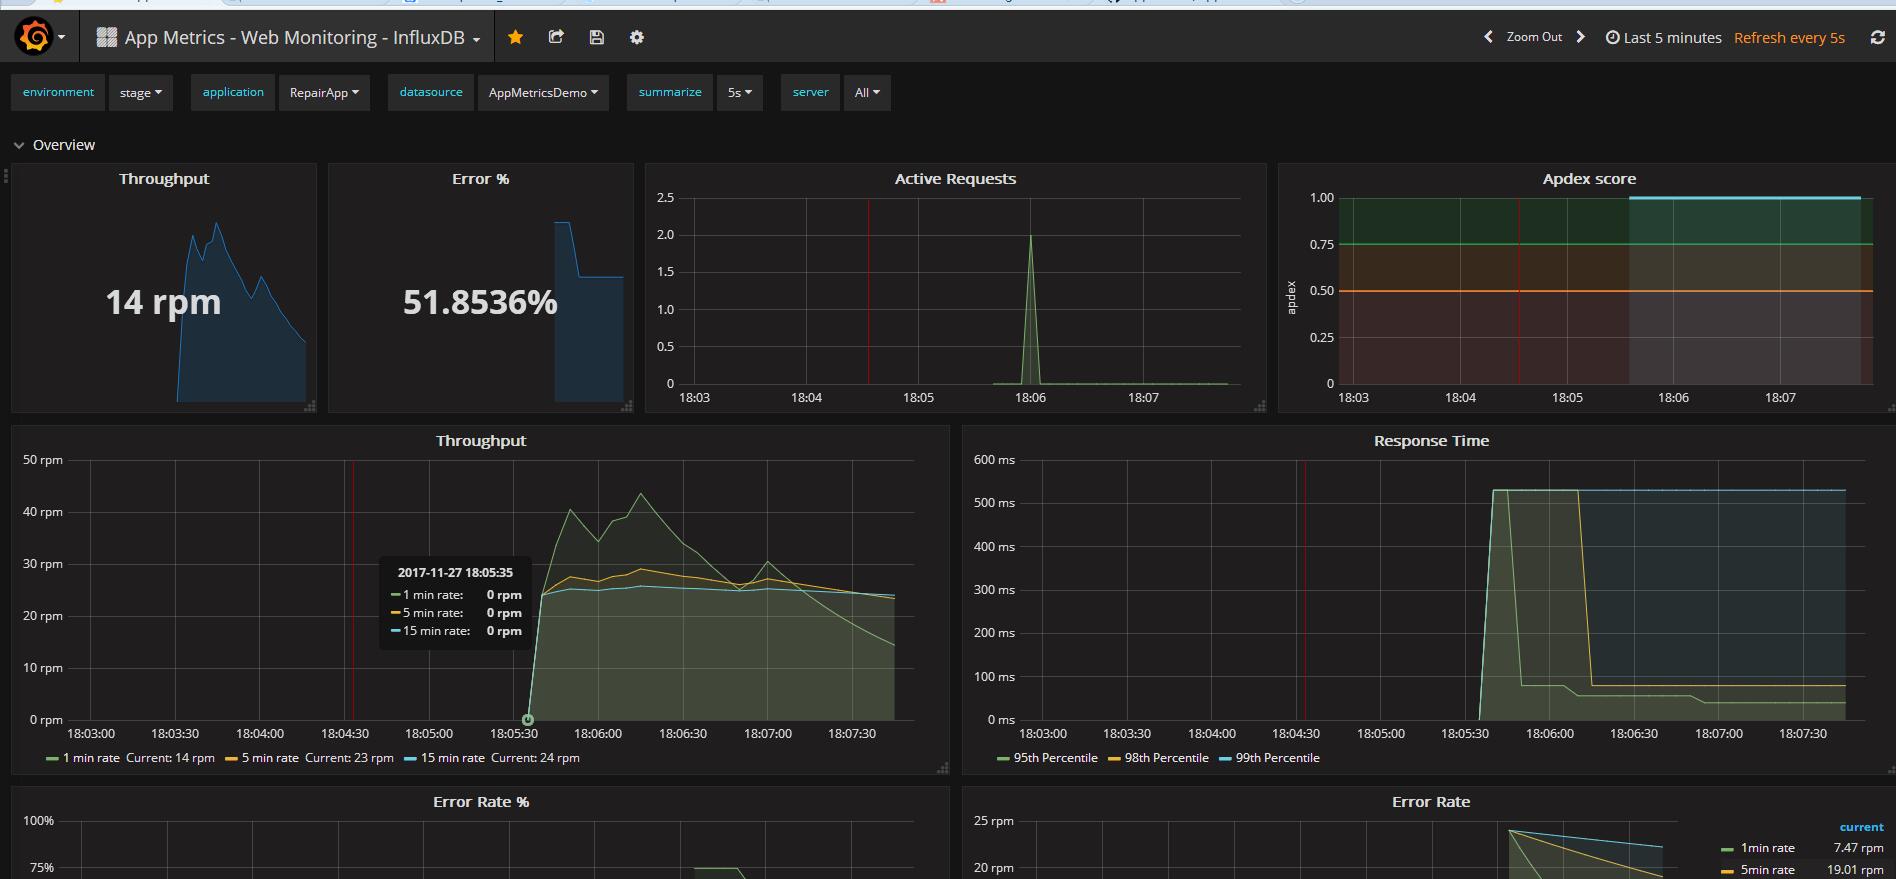
接下来运行项目,访问以下,然后看看Grafana中的仪表盘看看
附上demo地址:https://github.com/landonzeng/AppMetricsDemo
原文: http://www.cnblogs.com/landonzeng/p/7904402.html